Five Number Summary
Consists of
- '’Minimum’’: the lowest point
- '’First quartile’’: the ¼ point in data
- '’Median’’: the center of data
- '’Third quartile’’: the ¾ point in dat.
- '’Maximum’’: the largest point
If a sample has even length, then the median is average of the two middle points:
- $\text{median} = \cfrac{a_{n/2} + a_{n/2 + 1}}{2}$
Same applies to 1st and 3rd quartiles
In R, command summary returns the 5 number summary as well as the mean
Visualization
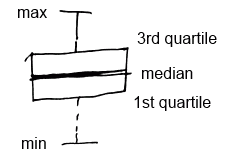
Box Plot
A visual summary of all the 5 numbers is called a ‘‘box plot’’
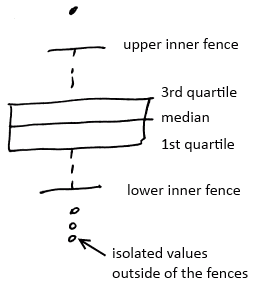
'’Modified box plot’’
- is a variation of the box plot
- it’s used to explain data with unusual values - Outliers
Measures of the Center
- Median is a measure of the center.
-
- But there is another measure - Mean or average value
- $\text{mean} = \cfrac{1}{n} \sum x_i$
- Where $n$ - number of data values, and $x_i$ - each data value.
The Spread
Mean and median don’t show how spread the data is. There is another measure that address it: Variance.
- $\text{var}(x) = \cfrac{1}{n - 1} \sum (x_i - \bar{x})^2$
- $s(x) = \text{std}(x) = \sqrt{\text{var}(x)}$
- ($n - 1$ gives “unbiased” estimate of the variance ) |
in R:
text only
st.dev = sd(data)