Density Plot
It’s like a Histogram, but smoothed out
- The smooting is done with Kernels
- So it’s an estimation of the Probability Density Function of the underlying variable
=== With Histogram === ```text only hist(pData$AGEP, breaks=12, col=”red”, prob=T) dens = density(pData$AGEP, adjust=2) lines(dens, col=”blue”, lwd=2)
- <img src="https://raw.githubusercontent.com/alexeygrigorev/wiki-figures/master/crs/da/density-hist.png" alt="Image"> [http://stackoverflow.com/q/1497539/861423]
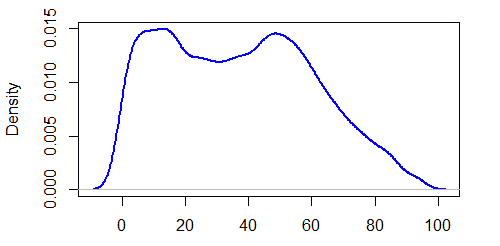
### Without Histogram
```text only
dens = density(pData$AGEP)
plot(dens, lwd=3, col="blue")
Bivariate Analysis
- this plot can also be used with two variables
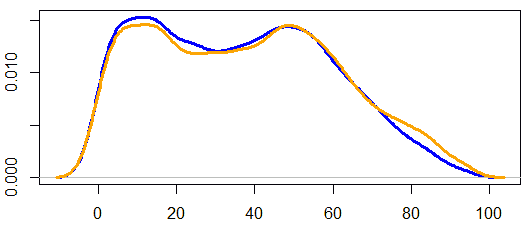
- it is more convenient than Histograms for doing that
- since it uses plot, not bars
text only
densM = density(pData$AGEP[which(pData$SEX==1)])
densF = density(pData$AGEP[which(pData$SEX==2)])
plot(densM, lwd=3, col="blue")
lines(densF, lwd=3, col="orange")
Links
- http://en.wikipedia.org/wiki/Density_estimation