Histogram
'’Histogram’’ is a graphical representation of the Distribution of data
- Bins: the intervals used in a histogram. The data must be separated into mutually exclusive and exhaustive bins
- Cutpoints: the values that define the beginning and the end of the bins
- Frequency: the count of the number of the data values in each bin
- The peaks in the distribution are called ‘‘modes’’
- so the variables you plot must be Quantitative Variables
- with histogram you estimate the Probability Density Function of the underlying variable
- Alternative - Density Plot that use Kernels to smooth the plots
text only
hist(d$age, col="blue")
- Params
breaks=100- how many bars in the histogram
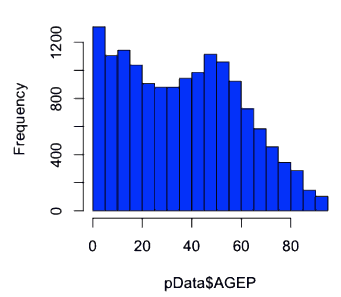
- here we have 19 bins, and two modes
Bivariate Analysis
It can also be useful for Exploratory Data Analysis of two variables
Consider this example
- we have two classes of customers: $A$ and $B$
- and we want to build a model that can distinguish them
- so we can create a histogram that shows the distribution of age w.r.t. to class attribute
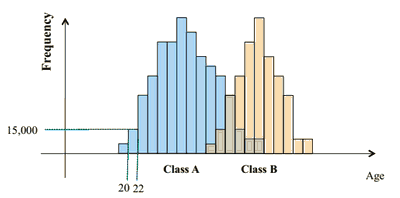
- can see that age and class are not independent: there is strong correlation between them:
- if age is lower then some value (say 30), all belong to class $A$
- if greater than other value - all always belong to class $B$
- can learn that just using a simple histogram
Cumulative Histogram
Usual histogram estimates the Probability Density Function
- Cumulative Histogram will show the Cumulative Distribution Function