Sampling
'’Statistical Inference’’ - making conclusions and decisions incomplete information in based on data. This is the main goal of Statistics
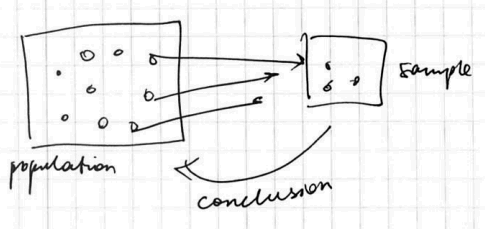
- '’Population’’ - the group we’re interested in making conclusions about.
- '’Census’’ - collection of data from the entire population
- Census is almost impossible or very expensive to obtain
- '’Sample’’ - a subset of the population, typically a small fraction
Goals
So, the goal of sampling (data collection):
- based on a sample make conclusions about the population
- this is done at the Data Collection step in the process of statistical investigation (see Statistics)
For ML models there are other goals
- how to reduce data to speed up computation?
- select a subset of rows - a ‘‘sample’’
Types of Sampling
We need a ‘‘representative’’ sample to be able to generalize from the statistics calculated on a sample to the population parameters
- For that we need to use randomization - and have #Random Sampling
- otherwise can have #Non-Random Sampling
Random Sampling
Random sampling (especially SRS - simple random sampling) is very important
- in Inferential Statistics - when making the independence assumption about the observations
- doesn’t introduce bias
Replacements
- ’'’without replacement’’’
- when item is selected for a sampling, it’s taken out of the population
- sampling ‘'’with replacement’’’
- an item can be sampled several times
- used in the Bootstrap method - for resampling
- also see Simulation Basics in R#Sampling
Simple Random Sampling
Randomly pick up items from the population
- the original distribution of data is not always kept
Stratified Sampling
Stratified Sampling
- divide the population into non-overlapping groups (called ‘‘strata’’)
- and use SRS within each stratum
- so the original distribution is kept
Also called
- Sampling with proportional allocation
- Under-sampling of the majority class
- etc
Cluster Sampling
Cluster Sampling
- use Cluster Analysis to divide the population into clusters
- select a cluster at random and use all the items from that cluster
- Use then it’s easer to select a group than an item
Examples
Example 1
- 1 mln elements
- 5% True, 95% False
- want to sample 100 examples
- proportional (stratified): 5 True, 95 False
- without proportional (uniform): 50 True, 50 False
Reason to use proportional
- suppose you need to be good at detecting TRUE
-
but you’ll have only 5 records to train your classified - not enough - so it’s better to use stratified sampling
Stratified Sampling Example
Assume a company with the following allocation of staff
| Full Time | Part Time | Male | 90 | 18 | Female | 9 | 63 |
How to build a sample of 40 staff?
- Stratified with proportional allocation: according to the distribution
- total number: $N = 180$
- calculate the percentage in each group
| Full Time | Part Time | Male | 90 / 180 = 50% | 18 / 180 = 10% | Female | 9 / 180 = 5% | 63 / 180 = 35% |
So we know that
- 50% in out sample of 40 should be males, full time
| Full Time | Part Time | Male | 20 | 4 | Female | 2 | 14 |
Non-Random Sampling
- Systematic sampling
- every $n$th individual, non-representative is there’s a structure
- Convenience / Volunteer sampling
- select first $n$ who are available or volunteer to participate. Also non-representative
- all these may introduce bias into the samples
Bias
- A sample is biased if it’s differs from a population in a systematic way
- That can result in a statistics that’s consistently larger or smaller
=== Types of Biases ===
- Selection bias - when you systematically exclude or under-represent a part of population
- Measurement/Response bias - when data is collected with systematic error
- Non-response bias - when responses aren’t obtained from all individuals selected for inclusion in sampling