Overfitting
'’Overfitting’’ (or ‘‘high variance’’) - if we have too many features, the learning hypothesis may
- fit the training set very well (with cost function $J(\theta) \approx 0$),
- but fail to generalize to new examples (predict for new data)
Generalization Error
Cross-Validation
Best way to see if you overfit:
- split data in training and test set
- train the model on training set
- evaluate the model on the training set
- evaluate the model on the test set
- generalization error: difference between them, measures the ability to generalize
It’s clear that a model overfits when we plot the generalization error
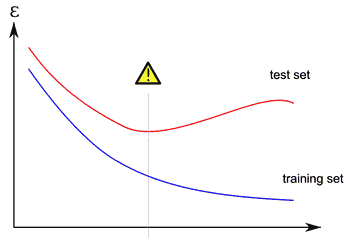
- we have low error on the training data, but high on the testing data
- may perform Machine Learning Diagnosis to see that
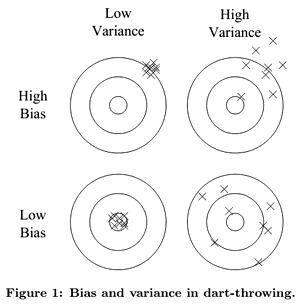
High Variance vs High Bias
Generalization error can be decomposed into bias and variance
- bias: tendency to constantly learn the same wrong thing
- variance: tendency to learn random things irrespective to the input data
Dart throwing illustration:
Underfitting
- high bias, low variance
- you’re always missing in the same way
example:
- predict always the same
- very insensible to the data
-
the variance is very low (0) - but it has high bias - it’s wrong
Examples
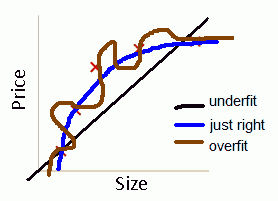
Multivariate Linear Regression
Suppose we have a set of data
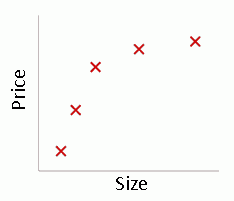
- We can fit the following Multivariate Linear Regression model
- linear: $\theta_0 + \theta_1 x$, likely to underfit (high bias)
- quadratic: $\theta_0 + \theta_1 x + \theta_2 x^2 $
-
- extreme: $\theta_0 + \theta_1 x + \theta_2 x^2 + \theta_3 x^3 + \theta_4 x^4 $
Logistic Regression
Same applies for Logistic Regression
- Suppose we have the following set
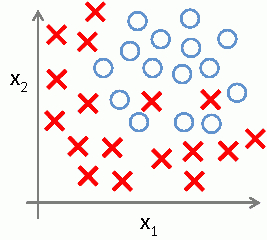
- We may underfit with just a line
- $g(\theta_0 + \theta_1 x_1 + \theta_2 x_2)$
- We may perform just right, but missing some positive examples
- $g(\theta_0 + \theta_1 x_1 + \theta_2 x_2 + \theta_3 x_1^2 + \theta_4 x_2^2 + \theta_5 x_1 x_2)$
- Or we may overfit using high-polynomial model
- $g(\theta_0 + \theta_1 x_1 + \theta_2 x_2 + \theta_3 x_1^2 + \theta_4 x_2^2 + \theta_5 x_1 x_2 + \theta_6 x_1^2 x_2 + \theta_7 x_1 x_2^2 + \theta_8 x_1^2 x_2^2 + \theta_9 x_1^3 + …)$
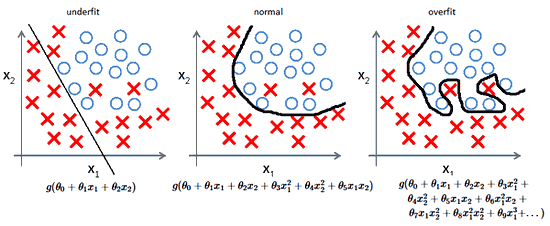
The problem with it
- overly high polynomial
-
it can fit anything - it overfits - results in high variance
Diagnosing
How to Diagnose the Problem
To identify overfitting we can use Machine Learning Diagnosis:
How to Address the Problem
- plotting - doesn’t work with many features
- reducing the number of features
- manually select features to keep
- Model Selection algorithm (chooses good features by itself)
- but it may turn out that some of the features we want to throw away are significant
- Principal Component Analysis
- Regularization
- keep all the features but reduce the magnitude of parameters
- Cross-Validation
- test your hypotheses on cross-validation set
Sources
- Machine Learning (coursera)
- Data Mining (UFRT)
- Introduction to Data Science (coursera)
- Domingos, Pedro. “A few useful things to know about machine learning.” [http://homes.cs.washington.edu/~pedrod/papers/cacm12.pdf]